

View source on GitHub
GET requests. It does not affect any organization settings or conversations.
Screenshots
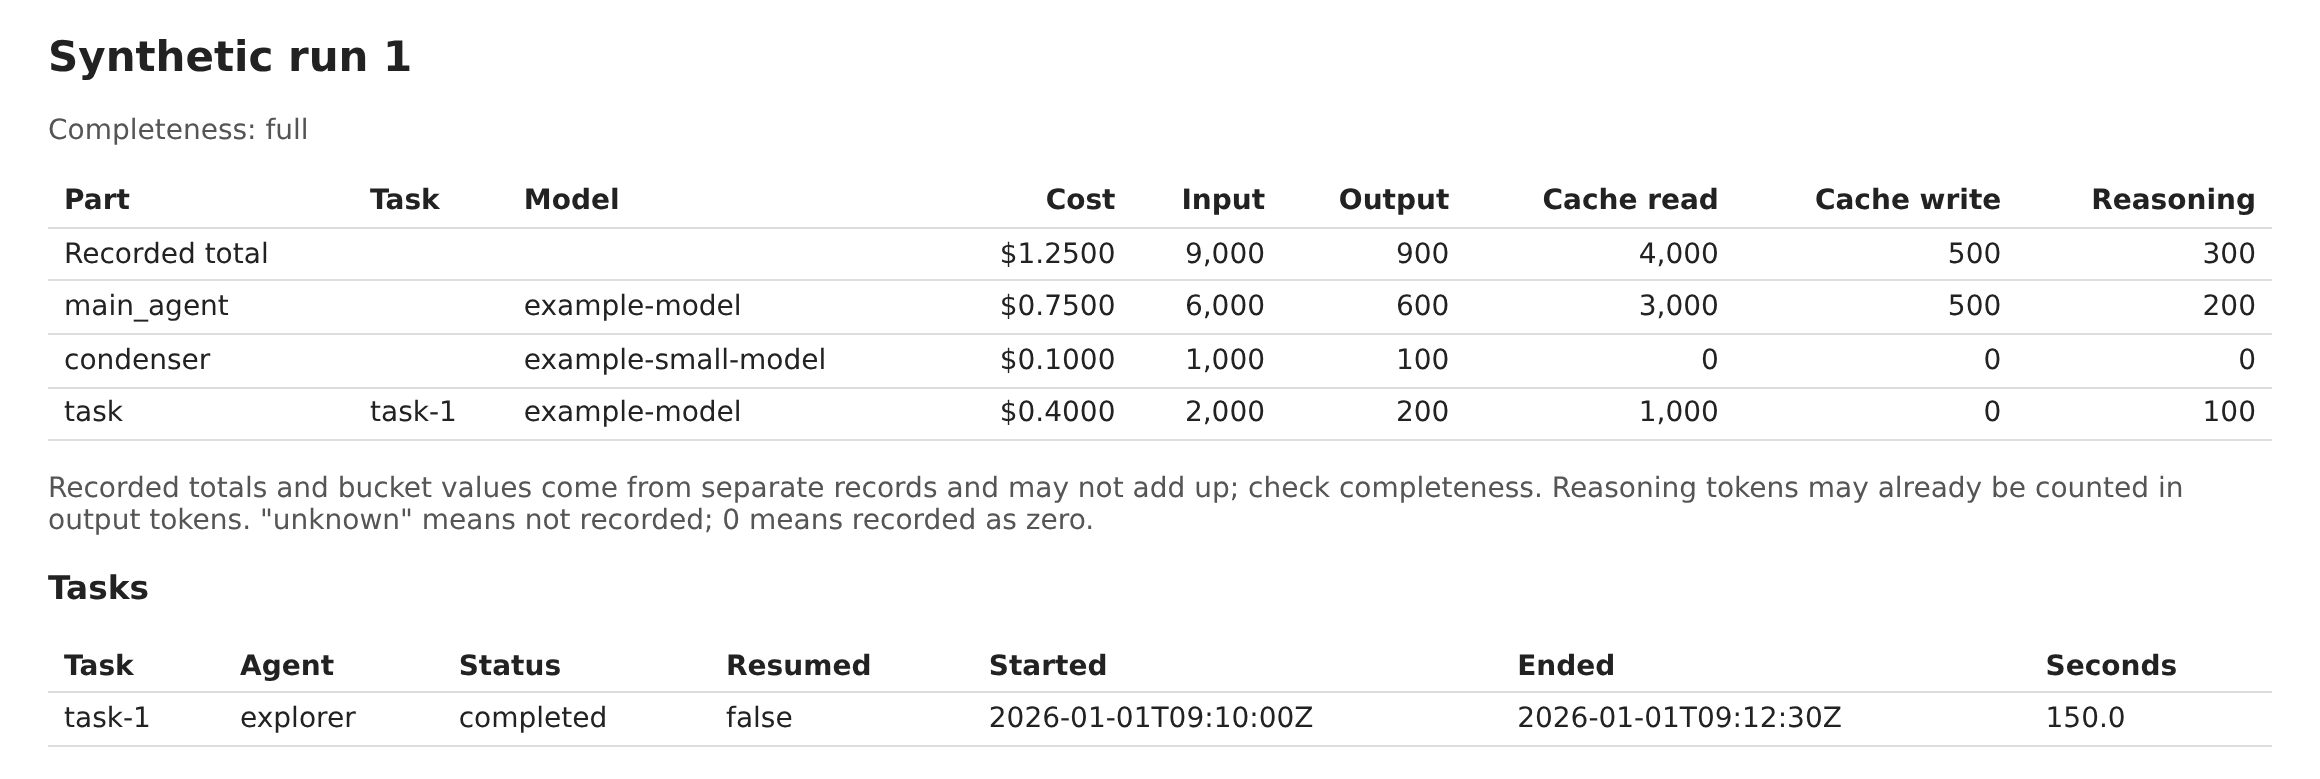
These screenshots use made-up conversations and usage data. Filter the conversation list by search, status, and tags: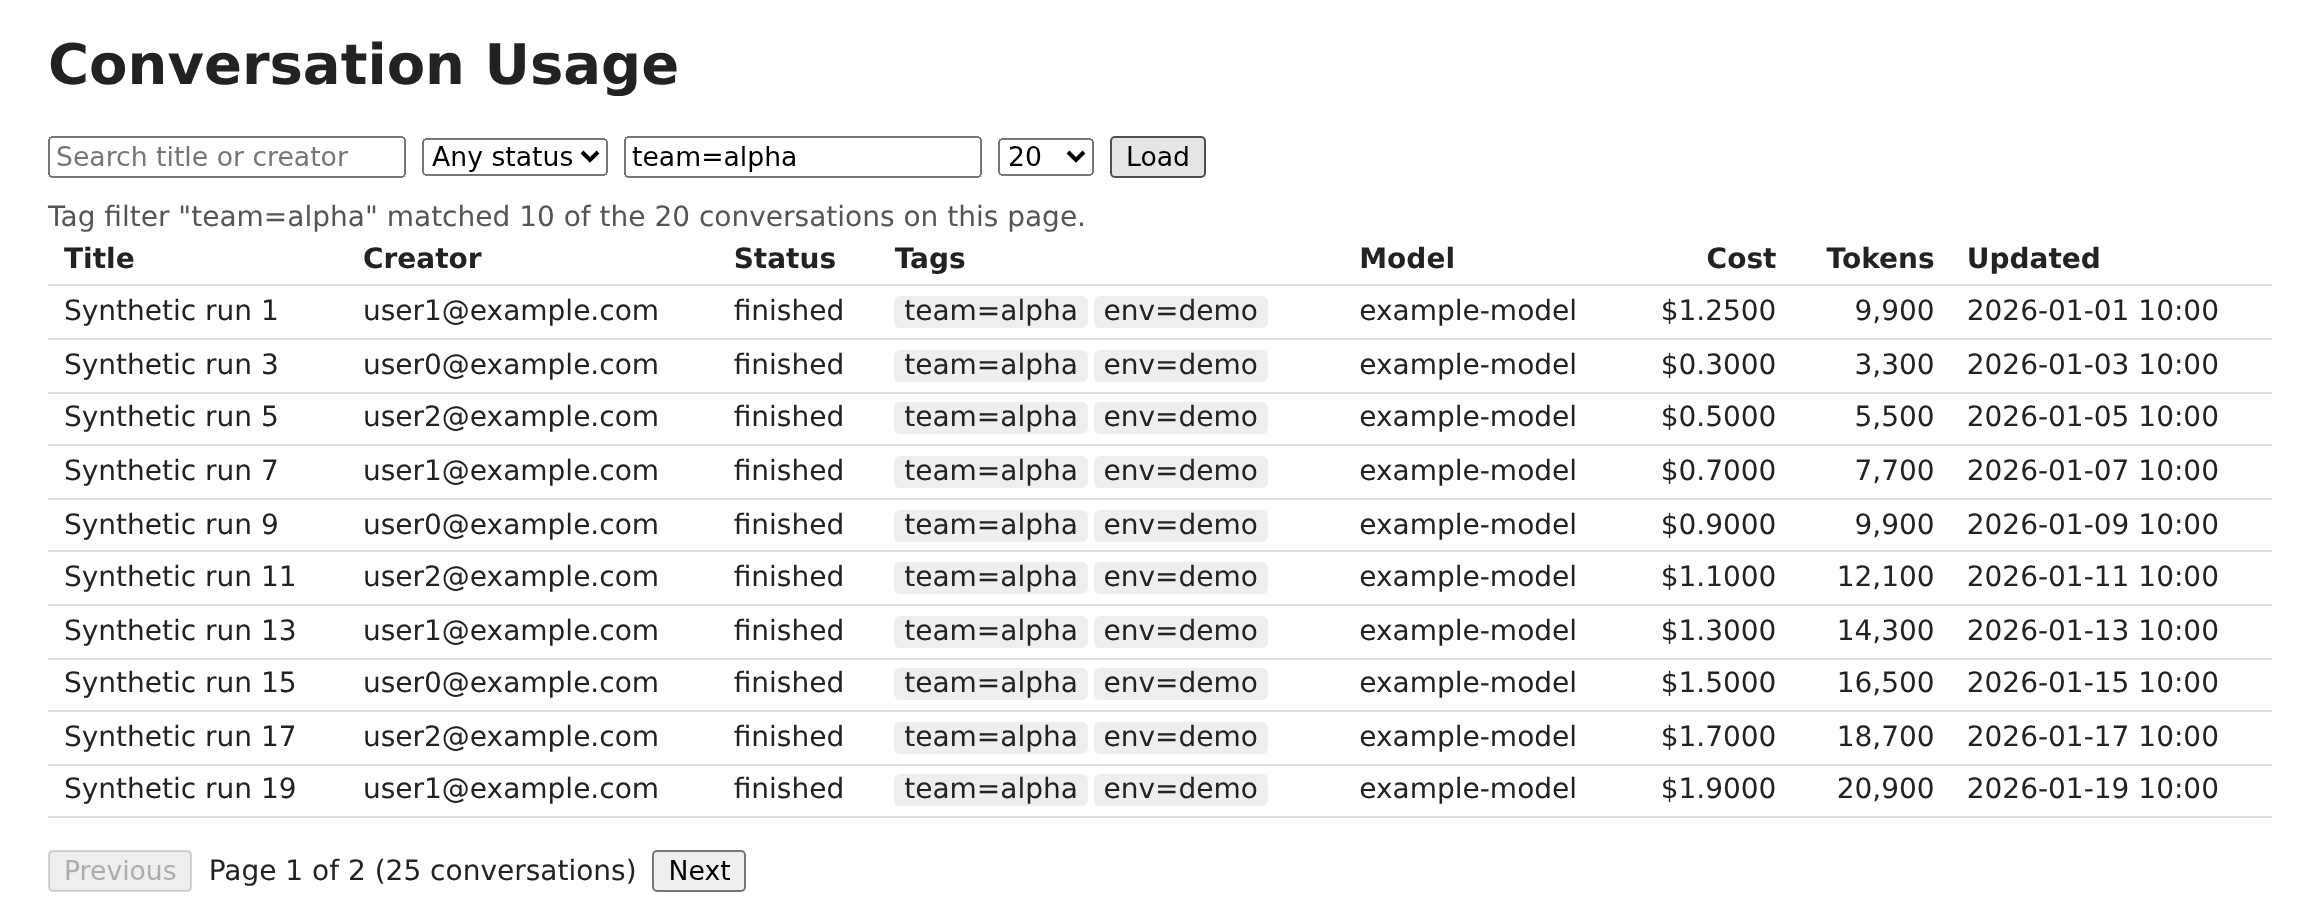 Select a conversation to inspect its agent-level usage and task timing:
How It Works
The browser displays the dashboard, and the Python server gets its data from OpenHands. The API key stays in Python; it isn’t sent to the browser. Two API calls drive the page:- List conversations.
UsageClient.list_conversations()inusage_dashboard.pyfetches one page of conversations with their titles, user tags, creators, status, and total usage. Search and status filters are sent with this request. - Read a conversation’s usage. When you select a row,
UsageClient.get_usage()fetches its agent-level breakdown and task timing.index.htmlturns that response into the detail tables.
Prerequisites
- OpenHands Enterprise 0.110.0 or later, or OpenHands Cloud.
- An API key for an Owner or Admin of the organization. Members and service accounts can’t list organization conversations or read detailed usage.
Run It
--port or
PORT to change the port. The key is read only from OH_API_KEY.
Customize the Dashboard
Start with the part you want to change:
For example, replace the free-text tag filter with a dropdown of your teams.
Keep the field name
tag and send values such as team=demo; the existing
Python filter will handle them. The tag filter checks only the loaded page,
because the organization list API doesn’t filter by tag.
The status filter sends one execution_status value. The API accepts several
statuses if you repeat the parameter, such as
execution_status=running&execution_status=paused. Its reference describes a
comma-separated list, but release 1.94.1 treats running,paused as one value.
If you add usage calculations, keep conversation totals separate from their
agent breakdown so you don’t count the same usage twice. Keep the
completeness indicator visible, and treat an unknown value differently from
zero.
Turn On Detailed Usage
The conversation list works with the default settings. Detailed usage is off by default, and until it is on, selecting a conversation shows:false to turn it off again. The change takes effect on the next
request; the list and totals keep working. See
Conversation Usage Access.
That page calls the base URL OH_BASE_URL; this example uses OH_API_BASE.
Try It With Synthetic Data
tests/fixture_api.py serves made-up data in the
same shape as the API. Use it to explore the page and try changes without a
real organization or API key.
Install requests with pip install requests, then use two terminals.
In one terminal, start the test API from this example’s directory:
http://127.0.0.1:8501 to see the list. To enable detailed usage in the
test API, open http://127.0.0.1:8600/__fixture/detail?enabled=1 in your browser,
then return to the dashboard and select a conversation. This control changes
only the test API. Use enabled=0 to turn it off again.
Press Ctrl+C in each terminal when you’re finished.
Run the tests from the repository root with uv run pytest conversation-usage-dashboard.
APIs Used
Related
conversation-metrics
Cost and token totals from the command line
conversation-tags
Add the tags shown in the list
Roles and Permissions
Who can view organization conversations and usage